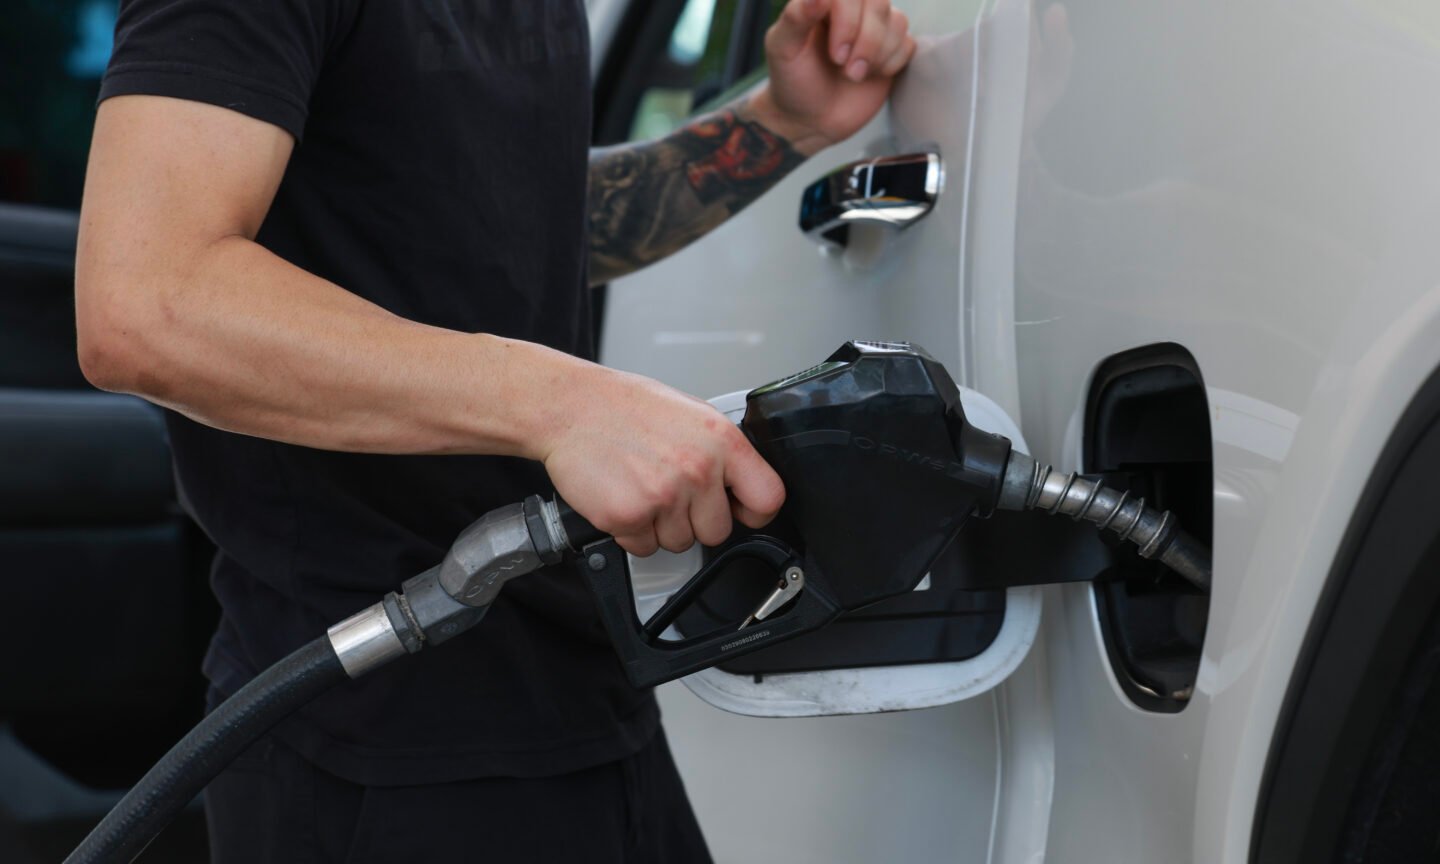
Barring sudden changes, the national average price of gas looks like it could soon drop below $3 per gallon for the first time since May 2021. It’s an arbitrary threshold but it feels significant. 2021 prices? That’s practically pre-pandemic!
As prices fall, drivers are regaining some buying power at the gas pump. To show how much, let’s say you have $20 to spend on fuel, and you’re paying the national average for regular gas (as of Oct. 28).
-
At the current U.S. average price of $3.13 per gallon, you could buy about six gallons for $20, filling roughly half a tank. (Gas tanks typically hold between 12 and 15 gallons of fuel, according to JD Power.)
-
Compare that to a year ago: Gas cost $3.50 on average, meaning you could buy a little more than 5.5 gallons for $20.
-
In June 2022, when the national average peaked at $5.02 per gallon, $20 would get you just four gallons — roughly a third of a tank.
Gas prices vary widely by state. In fact, 20 states already pay less than $3 per gallon for regular gas, while it’s still above $4 per gallon in three states. Here’s what $20 will get you in the states where gas is priced highest and lowest:
-
Highest: California. 4.35 gallons at an average price of $4.60.
-
Lowest: Texas. 7.5 gallons at an average price of $2.67.
The table below shows how far $20 goes where you live.
Is $3 per gallon cheap now?
After two years of high inflation, your reaction to $3 gas (or your state’s equivalent) might be complicated. Falling prices might bring relief to your budget. But you also might scoff at the hoopla over a price that’s still a far cry from what you’d consider “cheap gas.”
Maybe $2 per gallon is more what you have in mind as the threshold for better gas prices. That was the national average 20 years ago, and we got a recent taste of it when gas prices plummeted in the early days of the pandemic in 2020. (It was a short-lived shock driven by the sudden evaporation of fuel demand.)
It’s true that if you were driving in 2004 and had the same 20 bucks to spend on gas, you could’ve bought four more gallons than you can now. But there’s a twist: In 2004, you didn’t have the same $20. After all, we’re talking about inflation, which not only impacts prices but also wages.
When comparing prices over time, the underlying question is about affordability, says Jeremy Horpedahl, an economics professor at the University of Central Arkansas. To measure affordability, it’s more helpful to compare the price of a particular good to wages. “That tells you, can people buy more or less of the good than in the past?”
Measuring the affordability of gas
If you think about spending on gas in terms of how long it takes you to earn that $20 now compared to 20 years ago, you might be surprised at how affordable gas actually is.
The average worker earned $30.33 per hour in September 2024, according to U.S. Bureau of Labor Statistics data retrieved from the Federal Reserve Bank of St. Louis. The data tracks the average hourly earnings of production and nonsupervisory employees in the private sector, and Horpedahl recommends using it because it’s a broad-based metric that excludes managerial wages that would skew the numbers higher. It’s also the most up-to-date.
For comparison, the average hourly wage was $23.68 in September 2019, before the COVID-19 pandemic. And the average worker earned $15.78 per hour in September 2004, when gas prices hovered around $2 per gallon.
Based on September’s average hourly rate, it now takes about 40 minutes for the average worker to earn $20. Spending that on gas (at the current national average price) gets you a little over six gallons of gas. Buying the same amount of gas took 41 minutes of work in 2019 and 43 minutes in 2004.
So, for the moment, and despite the roller coaster of the last few years, it’s like gas prices have hardly changed at all.
(Photo by Joe Raedle/Getty Images)

